Introducing the Ashrei Immigration Data Dashboard
Every day in Missouri, families are impacted by immigration enforcement. A parent doesn't come home from work. A spouse is suddenly detained. Children face uncertainty. Loved ones scramble to understand a complex system while navigating fear, separation, and loss.
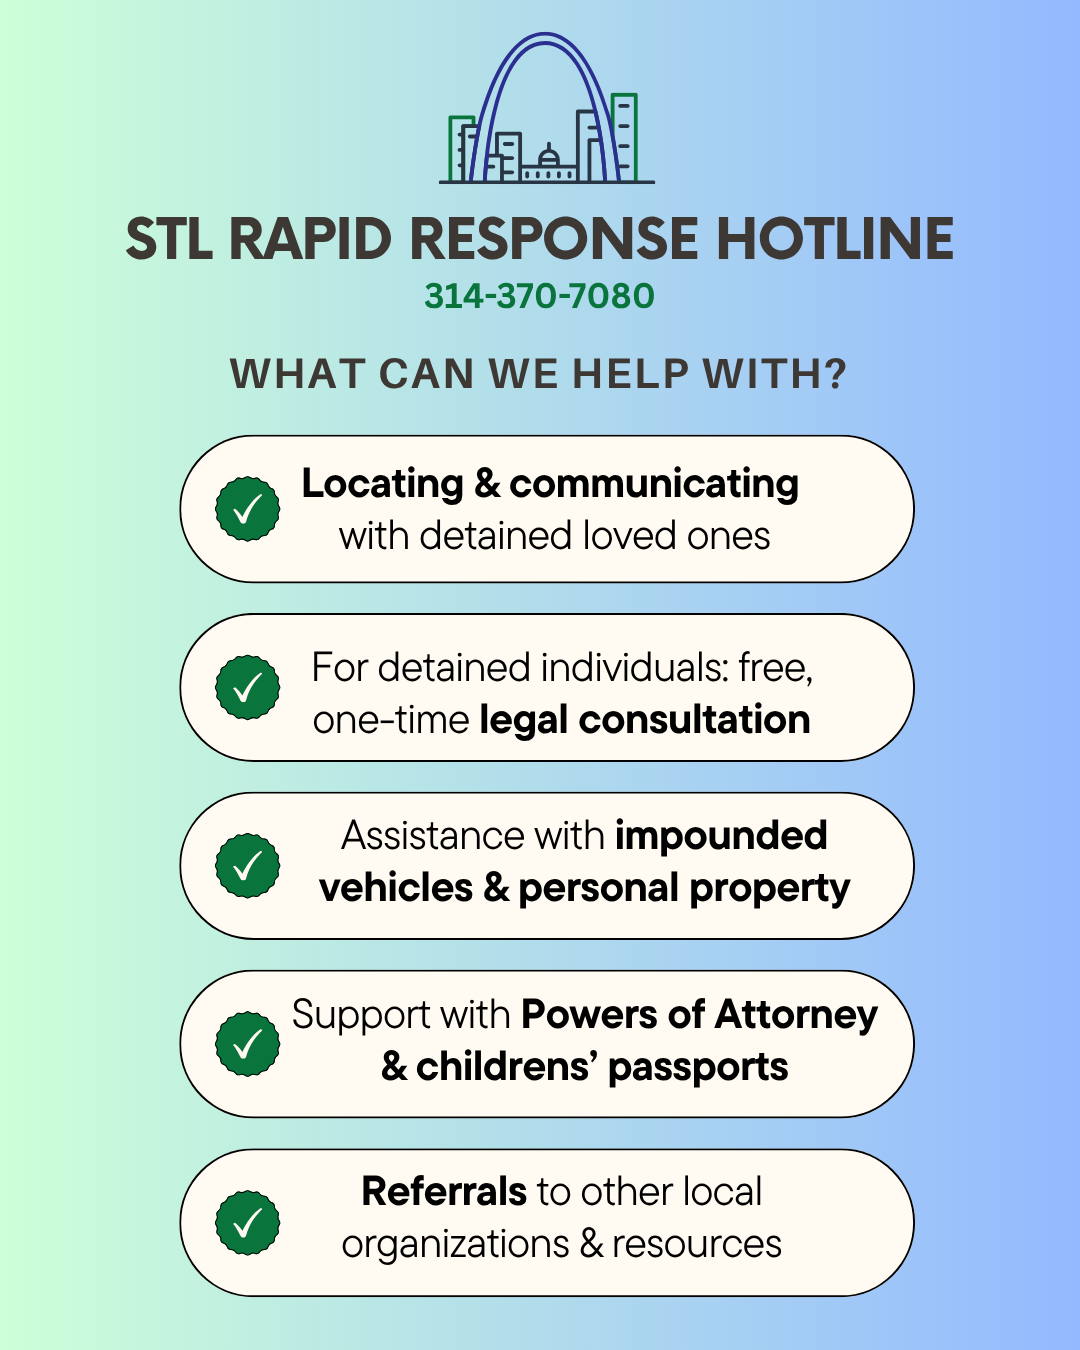
For the past year and a half, the St. Louis Rapid Response Hotline has served as a point of connection and support during these moments of crisis. Through the Hotline, Ashrei and our community partners work alongside detained immigrants, family members, coworkers, and concerned community members as they navigate the consequences of immigration enforcement.
We are proud to launch the Ashrei Immigration Data Dashboard, a new public resource designed to increase understanding of immigration enforcement in Missouri and the greater St. Louis region.
Why We Created This Dashboard
Since January 2025, the Rapid Response Hotline has been collecting information from people directly impacted by immigration enforcement. In July 2025, when we transitioned to a new case management system and expanded our data collection practices, we have worked intentionally to improve the quality, consistency, and usefulness of the information we gather.
The need for this project became increasingly clear as we encountered a significant challenge: there is remarkably little publicly available information about immigration enforcement in our region.
Federal agencies release limited data, often with substantial delays, and very little local context.
Yet, every week, our volunteers speak directly with people in ICE custody, their family members, friends, employers, and community members who are trying to understand what is happening and how to respond.
By analyzing and sharing de-identified information collected through the Hotline, we hope to provide a clearer picture of immigration enforcement as it is experienced by people in our communities.
What the Dashboard Shows
The Immigration Data Dashboard consists of two complementary components:
Big Picture Data
The first section presents cumulative data collected since the beginning of the project. This view helps identify longer-term trends, patterns, and changes in immigration enforcement over time. Users can explore information related to detention locations, pathways into ICE custody, geographic trends, and other indicators that help illustrate the broader enforcement landscape.
Monthly Reports
The second section focuses on monthly snapshots of enforcement activity. These reports provide a closer look at what is happening on the ground, highlighting local trends and emerging patterns within specific time periods.
Together, these two perspectives allow us to examine both long-term developments and immediate community impacts.
What We Learn from the Hotline
When community members call the Rapid Response Hotline, they are offered two options:
To report suspected immigration enforcement activity they have witnessed.
To speak directly with a bilingual volunteer Hotline Operator for immediate support.
Our volunteer operators provide assistance in a variety of ways, including:
This direct service work generates important insights into how immigration enforcement affects individuals, families, and communities.
Not every detention in Missouri comes to the attention of the Hotline. Nevertheless, the information we gather helps illuminate critical questions:
Who is being detained?
Where are people being held?
How are individuals ending up in ICE custody?
What role do local law enforcement agencies play?
What are conditions like in Missouri's ICE-contracted detention facilities?
How are families and communities being affected?
Understanding these patterns helps inform advocacy, community organizing, service delivery, and policy discussions throughout the region.
The Human Stories Behind the Data
Data can reveal important trends, but numbers alone can never capture the full reality of immigration enforcement.
Behind every data point is a person: a parent, spouse, child, coworker, neighbor, friend, or community member. Behind every detention is a family navigating uncertainty, loss of income, interrupted routines, emotional distress, and separation from loved ones.
Hundreds of Missouri families have experienced these impacts during the time covered by this dashboard. While charts and maps help us understand the scope of the issue, they tell only part of the story.
Our hope is that this project contributes to a deeper understanding that remains grounded in the humanity of those most affected.
What the Data Is Already Showing
One emerging pattern has become increasingly difficult to ignore: immigration enforcement does not happen in isolation.
In the St. Louis region, many individuals who ultimately end up in ICE custody first encounter local law enforcement. Our data suggests that local police agencies play a significant role in the pathway that leads many people into Missouri's network of rural detention facilities.
These findings have generated important questions that community members, advocates, researchers, and policymakers continue to explore. By making this information publicly available, we hope to support informed conversations about the systems and institutions that shape immigration enforcement in our region.
A Living Project
This dashboard is not a finished product.
As we continue learning from impacted communities and refining our systems, the dashboard will evolve. We anticipate adding new fields, collecting new information, improving data quality, and developing additional ways to visualize and share what we learn.
We also hope to integrate local findings into conversations with national research and broader immigration trends, helping community members understand how Missouri fits within the larger landscape of immigration enforcement across the United States.
At the same time, we remain deeply committed to protecting confidentiality and honoring the sensitive nature of the information entrusted to us. All publicly shared data is de-identified, and we continually evaluate our practices to ensure that privacy and safety remain paramount.
A Collaborative Effort
The Immigration Data Dashboard would not have been possible without the dedication of countless people.
This project was made possible through the countless hours of volunteer labor spent learning new systems and entering data, and the deep collaboration of community partners committed to supporting families impacted by immigration enforcement. UMSL Coro Fellow Aubrey Lay was instrumental in organizing the data collected and designing the dashboard, and the consultation and guidance from Dr. Austin Kocher was invaluable.
We are especially grateful for our partnership with Abide in Love and its affiliates across Missouri, Oklahoma, and Ohio. Through direct visitation, communication, referrals, and resource sharing, these partners help ensure that detained individuals and their families receive meaningful support during times of crisis.
Together, we are building systems that work collaboratively rather than in isolation, because families facing detention deserve coordinated care, accurate information, and compassionate accompaniment.
Looking Forward
This dashboard is a tool for understanding, accountability, advocacy, and action.
We hope it helps community members better understand the realities of immigration enforcement in Missouri.
We aim to raise new questions, spark deeper conversations, and inform ongoing efforts to build systems that uphold the dignity and rights of all people.
Most importantly, this project will ensure that the experiences of those most directly impacted by immigration enforcement are not hidden from public view.
The Immigration Data Dashboard will be updated monthly. We invite you to explore the data, learn from the stories it reflects, and join us in building a more just and welcoming Missouri.